Entrepreneurial Geekiness
Entrepreneurial Geekiness
Ian is a London-based independent Chief Data Scientist who coaches teams, teaches and creates data products. More about Ian here.
Ian is a London-based independent Chief Data Scientist who coaches teams, teaches and creates data products.

Coaching

Training

Jobs

Products

Consulting
PyDataLondon 2018 and “Creating Correct and Capable Classifiers”
This weekend we ran PyDataLondon 2018, the fifth iteration of our conference (connected with our monthly PyDataLondon meetup). This year we grew to 500 attendees! Read about the past PyDataLondon 2017 here.
Updates – videos are online, reportedly we raised £91,000 towards open source support for NumFOCUS via ticket sales & sponsorship (all the London team are unpaid volunteers, this money goes back to NumFOCUS to support the PyData ecosystem).
Here’s a summary of what we covered with 500 attendees over 3 days:
- Packed schedule
- Three new chair persons – Marco, Cecilia and Florian – thanks for making the conference so great!
- Two sessions of lightning talks
- Book signing with Holden Karau (Spark), Steve Holden (Python Core) and myself (High Performance Python)
- Algorithmic art hackathon
- Pandas Sprint
- Hackathons for Art and Politics and Open Source Contributions
- A bigger and crazier Pub Quiz by the inimitable James Powell
- Slack channel to support collaboration
- Diversity lunch
- Creche
- Beginner bootcamp the day before the conference (thanks Conrad!)
- Look here for many more photos!
- Write-ups from co-chairs Cecilia and Marco and colleagues Miguel and Mark
On Thursday morning I co-ran a “Make your first open source contribution” with Nick (of PyDataEdinburgh). We had a group who’d rarely (or never) made a contribution to github. We managed to commit a couple of minor doc fixes, recreated a bug in ELI5 and subsequently a new (failing) test was submitted to the project. Great success! I’m interested in another bug if you want to make a contribution.
Great example of how to include the new starters in the community. Way to go @ianozsvald, @njr0 and @pydatalondon! #PyDataLDN https://t.co/K9sq4mRUJ7
— Miguel Martinez (@miguelmalvarez) April 28, 2018
Each room was packed with 150-200 people (with a comfy number of chairs for everyone!):
Great to be back at #PyDataLDN again! Really interesting talks this morning on modelling techniques and evaluation from Anna Veronika Dorogush @yandexcom, Thomas Huijskens and @ianozsvald. pic.twitter.com/qVTaOiOMNV
— Andrew Weeks (@meloncholy) April 28, 2018
One of our key NumFOCUS organisers is Leah Silen, she’s an unsung hero who makes every conference come together. She broke her foot recently and couldn’t fly over. It turns out the crowd rather misses her and all of her work. Get well soon!
At the conference I spoke on “Creating Correct and Capable Classifiers” (worked Notebook in my github repo, full video online). We took a look at starting with a baseline model, building a better stable model, visualising errors, diagnosing where it might be failing and explaining the end results to a colleague.
Wonderful talk by @ianozsvald at PyData London 2018, lots of great insights showing how to create capable classifiers.
— Ibrahim Sharaf (@_Sharraf) January 5, 2019
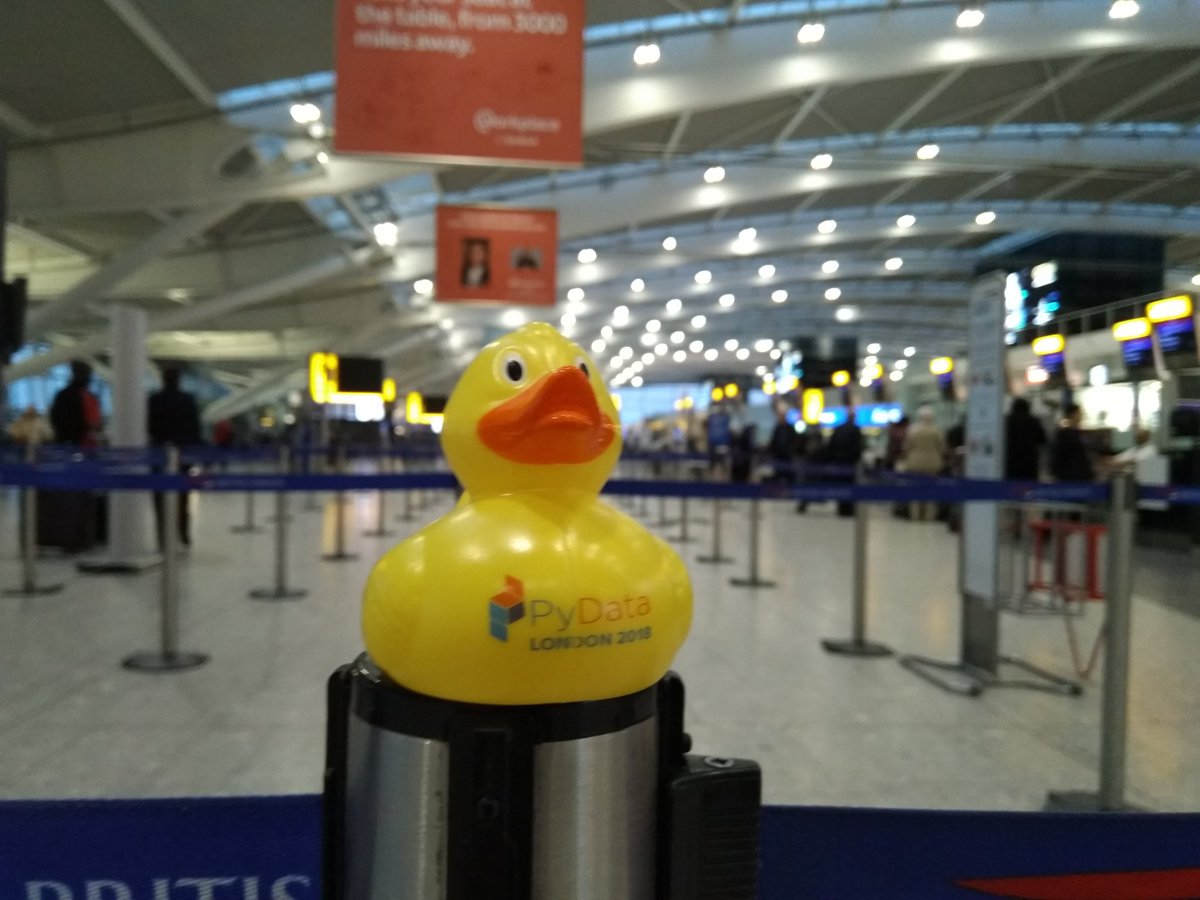
Many thanks to @matti of PyDataBerlin for taking a lovely photo of our speaker-duck gift for speakers:
Many thanks also to all of our volunteers and to the staff at the Tower Hotel – thanks for making the weekend so much fun 🙂
Ian is a Chief Interim Data Scientist via his Mor Consulting. Sign-up for Data Science tutorials in London and to hear about his data science thoughts and jobs. He lives in London, is walked by his high energy Springer Spaniel and is a consumer of fine coffees.
AHL Python Data Hackathon
Yesterday I got to attend Man AHL’s first London Python Data hackathon (21-22 April – photos online). I went with the goal of publishing my ipython_memory_usage tool from GitHub to PyPI (success!), updating the docs (success!) and starting to work on the YellowBrick project (partial-success).
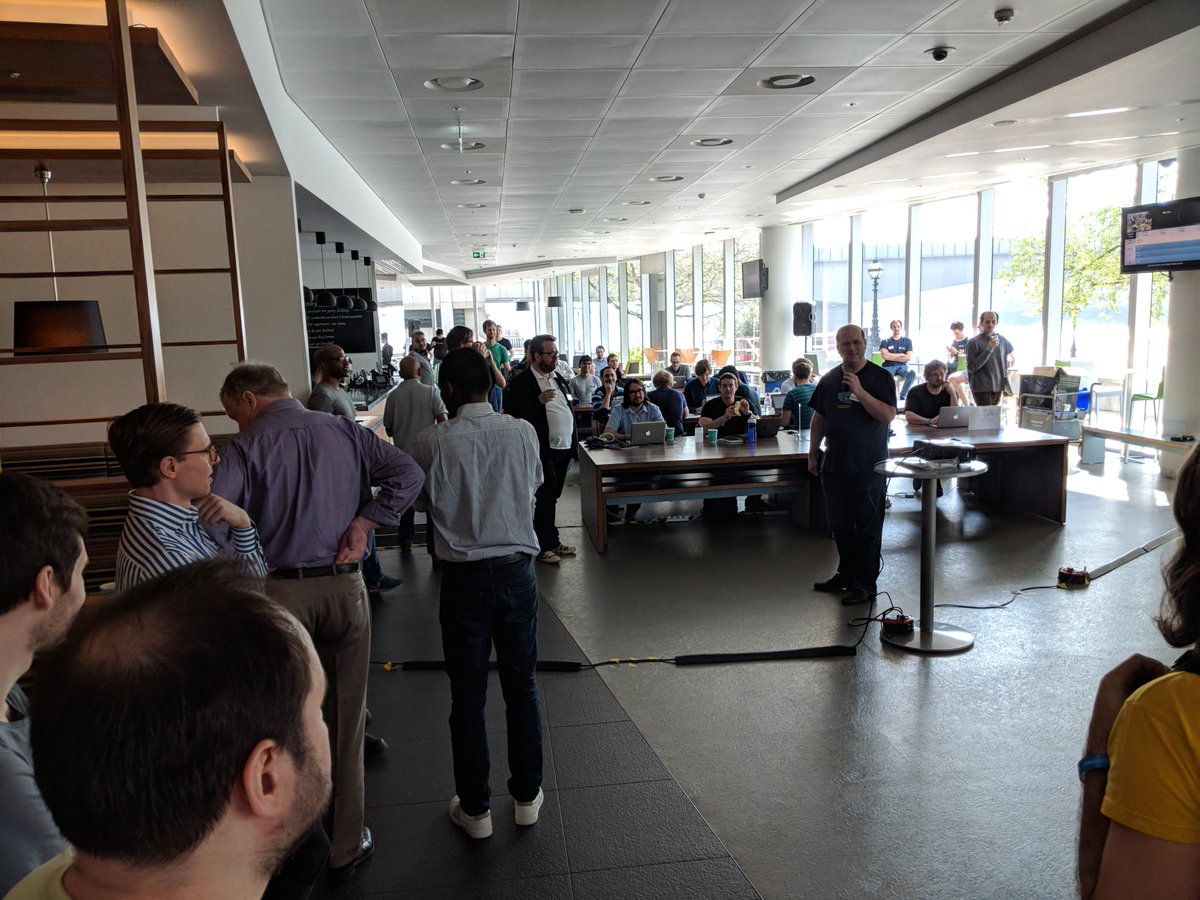
This is AHL’s first crack at running a public Python hackathon – from my perspective it went flawlessly. They use Python internally and they’ve been hosting my PyDataLondon meetup for a couple of years (and, all going well, for years to come), they support the Python ecosystem with public open source contributions and this hackathon was another method for them to contribute back. This is lovely (since so many companies aren’t so good at contributing and only consume from open source) and should be encouraged.
Here’s Bernd of AHL introducing the hackathon. We had 85 or so folk (10% women) in the room:
I (and 10 or so others) then introduced our projects. I was very happy to have 6 new contributors volunteer to my project. I introduced the goals, got everyone up to speed and then we split the work to fix the docs and to publish to the test PyPI server and then finally to the official PyPI public server.
This took around 3 hours, most of the team had some knowledge of a git workflow but none had seen my project before. With luck one of my colleagues will post a conda-forge recipe soon too. Here’s my team in action (photo taken by AHL’s own CTO Gary Collier):
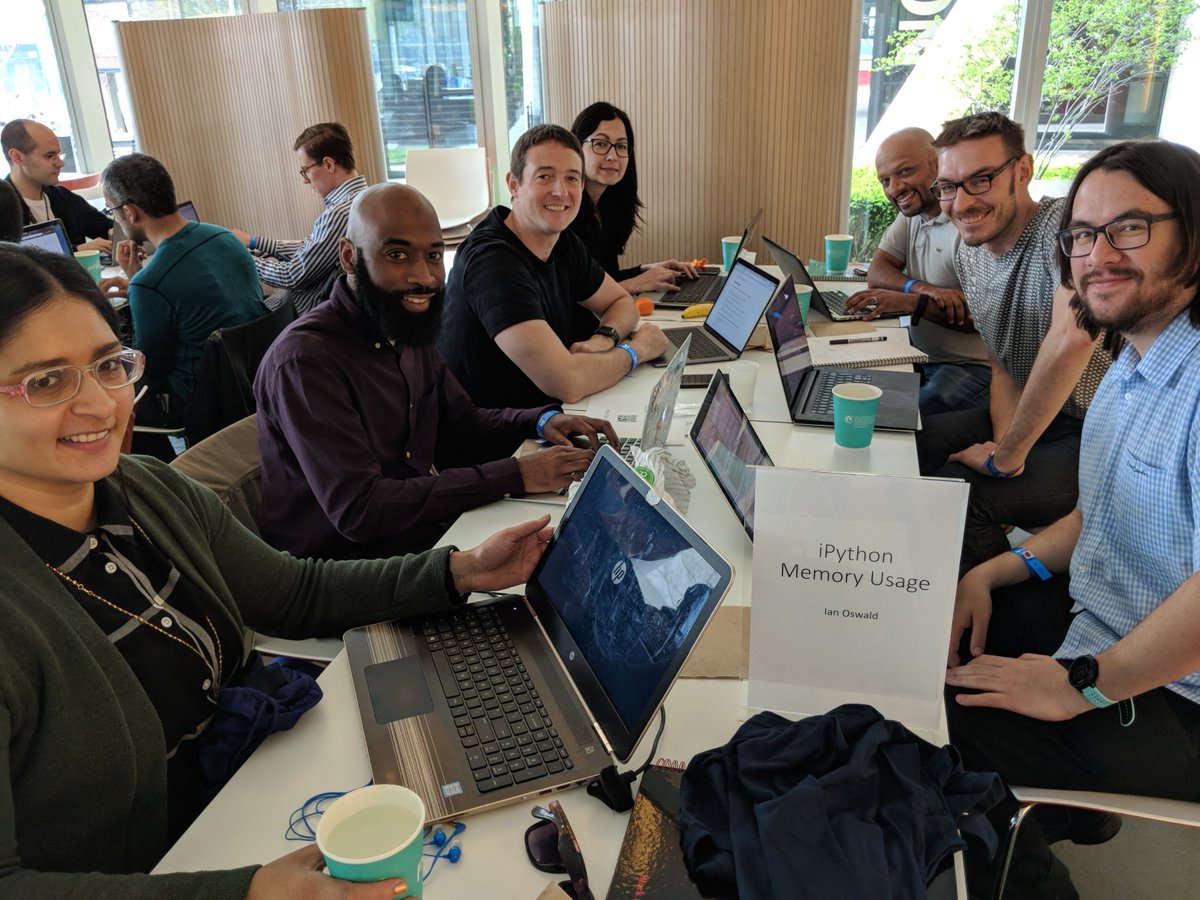
Many thanks to Hetal, Takuma, Robin, Lucija, Preyesh and Pav.
Robin had recently published his own project to PyPI so he had some handy links. Specifically we used twine and these notes. In addition the Pandas Sprint guide was useful for things like pulling the upstream master between our collaborative efforts (along with Robin’s notes).
This took about 3 hours. Next we had a crack at the sklearn-visualiser YellowBrick – first to get it running and tested and then to fix the docs on a recent code contribution I’d made (making a sklearn-compatible wrapper for statsmodels’ GLM) with some success. It turns out that we might need to work on the “get the tests” running process, they didn’t work well for a couple of us – this alone will make for a nice contribution once we’ve fixed it.
Overall this effort helped 6 people contribute to two new projects, where 5 of the collaborators had only some prior experience (as best I remember!) with making an open source contribution. I’m very happy with our output – thanks everyone!
Ian is a Chief Interim Data Scientist via his Mor Consulting. Sign-up for Data Science tutorials in London and to hear about his data science thoughts and jobs. He lives in London, is walked by his high energy Springer Spaniel and is a consumer of fine coffees.
PyData Conference & AHL Hackathon
Our 5th annual PyDataLondon conference will run this April 27-29th, this year we grow from 330 to 500 attendees. As before this remains a volunteer-run conference (with support from the lovely core NumFOCUS team), just as the monthly meetup is a volunteer-run event.
The Call for Proposals is open until the start of March (you have 2 weeks!) – first time speakers are keenly sought. Our mentorship programme is in full swing to help new speakers craft a good proposal, before it hits the (volunteer run) review committee. As usual we expect 2-3 submissions per speaking slot so the competition to speak at PyDataLondon will remain high. We also have a set of diversity grants to support those who might otherwise not attend the conference – don’t be afraid to apply to use a grant.
Tickets are on sale already, this year’s programme will go live towards the end of March. If you’d like a taste of what goes on at a PyDataLondon conference see my write-up from 2017and see the 2017 schedule.
The week before the conference our generous meetup hosts AHL are holding a Python Data Science Hackathon. You should definitely apply if you’re anywhere near London (I have!). They have budget to fly in some core developers – if your project hasn’t yet applied and you’re interested in being involved with a large open-source science hackathon, please do visit their site and apply. Here you have a chance to make a strong contribution to the open source tools that we all use.
Finally – if you’re interested in learning about the jobs that are going in the UK Python Data Science world, take a look at my data science jobs list. 7-10 jobs get emailed out every 2 weeks to over 900 people and people are successfully getting new jobs via this list.
Ian is a Chief Interim Data Scientist via his Mor Consulting. Sign-up for Data Science tutorials in London and to hear about his data science thoughts and jobs. He lives in London, is walked by his high energy Springer Spaniel and is a consumer of fine coffees.
Python Data Science jobs list into 2018
I’ve been building my data-science jobs list for a couple of years now. Almost 800 folk are on the list, they receive an email update once every two weeks containing around seven job ads. Many active members of PyDataLondon are on the list.
The ads are mostly London-based, a few spread into Europe. In addition to the jobs I’ve added a “book of the month” and “video of the month” recommendation along with an open source project that is after contributions from the community. If a selection of jobs and educational recommendations every couple of weeks feel like a useful addition to your inbox – join the mailchimp list here. Your email is never revealed, you’re in control, you can unsubscribe at any time.
“I’m very grateful for Ian’s job list as it enabled me to find a DS job in an interesting and meaningful domain, and furthermore connected me with likeminded folk. Strongly recommend.” – Frank Kelly, Senior Data Scientist @HAL24K
Companies who have advertised include AHL (our host for PyDataLondon), BBC, Channel 4, QBE Insurance, Willis Towers Watson, UCL and Cambridge Universities, HAL24K, Just Eat, Oxbotica, SkyScanner and many more. Roles range from junior to head-of-dept for data science and data engineering, most are permanent roles, some are contract roles.
“After placing a contract ad on this list I was contacted by a number of high quality and enthusiastic data scientists, who all proposed innovative and exciting solutions to my research problem, and were able to explain their proposals clearly to a non-specialist; the quality of responses was so high that I was presented with a real dilemma in choosing who to work with”. – Hazel Wilkinson, Cambridge University
Anyone can post to the list, PyDataLondon members get to make a first post to the list gratis (I take the time cost as a part of my usual activity of community-building in London). All posts come via me to check that they’re suitable, they go out every two weeks for three iterations. Contact me directly (ian.ozsvald at modelinsight dot io) if you’re interested in making a post.
Ian is a Chief Interim Data Scientist via his Mor Consulting. Sign-up for Data Science tutorials in London and to hear about his data science thoughts and jobs. He lives in London, is walked by his high energy Springer Spaniel and is a consumer of fine coffees.
PyDataBudapest and “Machine Learning Libraries You’d Wish You’d Known About”
I’m back at BudapestBI and this year it has its first PyDataBudapest track. Budapest is fun! I’ve had a second iteration talking on a slightly updated “Machine Learning Libraries You’d Wish You’d Known About” (updated from PyDataCardiff two weeks back). When I was here to give an opening keynote talk two years back the conference was a bit smaller, it has grown by +100 folk since then. There’s also a stronger emphasis on open source R and Python tools. As before, the quality of the members here is high – the conversations are great!
During my talk I used my Explaining Regression Predictions Notebook to cover:
- Dask to speed up Pandas
- TPOT to automate sklearn model building
- Yellowbrick for sklearn model visualisation
- ELI5 with Permutation Importance and model explanations
- LIME for model explanations

Some audience members asked about co-linearity detection and explanation. Whilst I don’t have a good answer for identifying these relationships, I’ve added a seaborn pairplot, a correlation plot and the Pandas Profiling tool to the Notebook which help to show these effects.
Although it is complicated, I’m still pretty happy with this ELI5 plot that’s explaining feature contributions to a set of cheap-to-expensive houses from the Boston dataset:

I’m planning to do some training on these sort of topics next year, join my training list if that might be of use.
Ian is a Chief Interim Data Scientist via his Mor Consulting. Sign-up for Data Science tutorials in London and to hear about his data science thoughts and jobs. He lives in London, is walked by his high energy Springer Spaniel and is a consumer of fine coffees.
Read my book
Oreilly High Performance Python by Micha Gorelick & Ian Ozsvald AI Consulting


Mor Consulting Ltd. is an A.I. focused consultancy offering strategic research and development owned by Ian Ozsvald, based in London (UK).
Co-organiser

PyData London provides a forum for the international community of users and developers of data analysis tools to share ideas and learn from each other.