Entrepreneurial Geekiness

Layers of “data science”?
The field of “data science” covers a lot of areas, it feels like there’s a continuum of layers that can be considered and lumping them all as “data science” is perhaps less helpful than it could be. Maybe by sharing my list you can help me with further insight. In terms of unlocking value in the underlying data I see the least to most valuable being:
- Storing data
- Making it searchable/accessible
- Augmenting it to fashion new data and insights
- Understanding what drives the trends in the data
- Predicting the future
Storing a “large” amount of data has always been feasible (data warehouses of the 90s don’t sound all that different to our current Big Data processing needs). If you’re dealing with daily Terabyte dumps from telecomms, astro arrays or LHCs then storing it might not be economical but it feels that more companies can easily store more data this decade than in previous decades.
Making the data instantly accessible is harder, this used to be the domain of commercial software and now we have the likes of postgres, mongodb and solr which scale rather well (though there will always be room for higher-spec solutions that deal with things like fsync down to the platter level reliably regardless of power supply and modeling less usual data structures like graphs efficiently). Since CPUs are cheap building a cluster of commodity high-spec machines is no longer a heavy task.
Augmenting our data can makes it more valuable. By example – applying sentiment analysis to a public tweet stream and adding private demographic information gives YouGov’s SoMA (disclosure – I’m working on this via AdaptiveLab) an edge in the brand-analysis game. Once you start joining datasets you have to start dealing with the thorny problems – how do we deal with missing data? If the tools only work with some languages (e.g. English), how do we deal with other languages (e.g. the variants of Spanish) to offer a similarly good product? How do we accurately disambiguate a mention of “apple” between a fruit and a company?
Modeling textual data is somewhat mainstream (witness the availability of Sentiment, NER and categorisation tools). Doing the same for photographs (e.g. Instagram photos) is in the quite-hard domain (have you ever seen a food-identifier classifier for photos that actually works?). We rarely see any augmentations for video. For audio we have song identification and speech recognition, I don’t recall coming across dog-bark/aeroplane/giggling classifiers (which you might find in YouTube videos). Graph network analysis tools are at an interesting stage, we’re only just witnessing them scale to large data amounts of data on commodity PCs and tieing this data to social networks or geographic networks still feels like the domain of commercial tools.
Understanding the trends and communicating them – combining different views on the data to understand what’s really occurring is hard, it still seems to involve a fair bit of art and experience. Visualisations seems to take us a long way to intuitively understanding what’s happening. I’ve started to play with a few for tweets, social graphs and email (unpublished as yet). Visualising many dimensions in 2 or 3D plots is rather tricky, doubly so when your data set contains >millions of points.
Predicting the future – in ecommerce this would be the pinacle – understanding the underlying trends well enough to be able to predict future outcomes from hypothesised actions. Here we need mathematical models that are strong enough to stand up to some rigorous testing (financial prediction is obviously an example, another would be inventory planning). This requires serious model building and thought and is solidly the realm of the statistician.
Currently we just talk about “data science” and often we should be specifying more clearing which sub-domain we’re involved with. Personally I sit somewhere in the middle of this stack, with a goal to move towards the statistical end. I’m not sure one how to define the names for these layers, I’d welcome insight.
This is probably too simple a way of thinking about the field – if you have thoughts I’d be most happy to receive them.
Ian is a Chief Interim Data Scientist via his Mor Consulting. Sign-up for Data Science tutorials in London and to hear about his data science thoughts and jobs. He lives in London, is walked by his high energy Springer Spaniel and is a consumer of fine coffees.
Do self-driving cars make the courier redundant?
I’ll start with a quote via “Why workers are losing the war against the machines” taken from A Farewell to Alms by economist Gregory Clark:
“There was a type of employee at the beginning of the Industrial Revolution whose job and livelihood largely vanished in the early twentieth century. This was the horse. The population of working horses actually peaked in England long after the Industrial Revolution, in 1901, when 3.25 million were at work. … There was always a wage at which all these horses could have remained employed. But that wage was so low that it did not pay for their feed. “
Now I’m back in London I’m watching the prevalence of couriers and delivery people bringing a constant stream of packages through the busy streets. I’m betting this will be automated in the near future. Couple self-driving cars and a physical-packet-delivery-platform that looks a bit like the Internet protocol and then you’ve got (I think) a bit of a game changer.
Update – future posts discuss other outcomes for self-driving cars and a hackday looked at making parking-bay utilisation more efficient in London.
Self-driving cars have the potential to be legal in cities (they’re legal in a few US states at present, accepting longer legal battles to come). They’ll drive safely and predictably, they’re unlikely to react erratically (e.g. no pulling out in busy streets for a foolish maneuver and hitting a cyclist), they don’t need a lunch break and they could pick-up and drop-off from depots a long way from traditional storage facilities (as nobody has to commute to the facility).
Consider one of these vehicles arriving outside your office and phoning you to give you a secret ID number. You come out to the street, key in the number, a panel pops open and there’s your package. Internally the packages are retrieved in a similar way to automated warehouses. Since the system is always calling home to report its status it could notify all upcoming delivery recipients of its expected ETA. You could probably buy an upgrade to reserve your delivery slot (giving delivery companies a new revenue stream?).
If they’re controlled via a derivative of the Internet Protocol then we have a decentralised physical-packet-routing system. If the cars can ‘mate’, perhaps by backing on to each other, they can trade packages so the packages travel further without human intervention. Maybe you end up with an open market for atoms-distribution, assuming compatible protocols exist amongst the courier companies.
I’ve followed John Robb’s recent discussion of DroneNet (more) – it is the same idea (props – I’m tagging on his/others’ thinking) applied to low cost drones. I think drones will follow later as they’re constrained by weight and flight restrictions and so they are far less useful in the city at present.
At the end of the day I think that humans will be pushed out of the physical package delivery game (be it via drones or via delivery cars). Trying to understand the speed at which humans will be removed from traditional working disciplines in specialist area continues to baffle me.
Update – economist Philippe Bracke notes that government legislation might slow the adoption of self-driving vehicles, giving drivers time to cross-train into other areas of work. He also notes that the adoption of driverless cars, perhaps operating at night (and maybe filled by petrol stations that offer discounted fuel at night as an attractor?), would reduce daytime congestion. This in turn might make it more likely that human-driver cars are more abundant by day, increasing urbanisation and raising house prices. Personally I’m not sure how to think about the second-order effects of changes like these.
Ian is a Chief Interim Data Scientist via his Mor Consulting. Sign-up for Data Science tutorials in London and to hear about his data science thoughts and jobs. He lives in London, is walked by his high energy Springer Spaniel and is a consumer of fine coffees.
Map/Reduce (Disco) on millions of tweets
Whilst working on data sciencey problems for AdaptiveLab I’m becoming more involved in simple visualisations for proof-of-concepts for clients. This ties in nicely with my PyCon Parallel Computing tutorial with Minesh. I’ve been prototyping a Disco map/reduce tutorial (part 2 for PyCon) using tweets collected during the life of SocialTies during 2011-2012.
Using 11,645,331 tweets on 1 machine running through Disco with a modified word_count example it is easy to filter to keep tweets with a certain word (“loving” in this case) and to plot a word cloud (thanks Andreas!) of the remaining tweets:

Tweet analysis often shows a self-referential nature – here we see “i’m” as one of the most popular words. It is nice to see “:)” making an appearance. Brands mentioned include “Google”, “iPhone”, “iPad”. We also see “thanks”, “love”, “nice” and “watching” along with “London” and “music”. Annoyingly I’m not cleaning the words so we see “it!”, “it.”, “(via” (with erroneous brackets) and the like which clutter the results a bit.
Next I’ve applied “hating” as the filter to the same set:

One of the most mentioned words is “people” which is a bit of a shame, along with “i’m”. Thankfully we see some “love” and “loving” there. “apple” appears more frequently than “twitter” or “google”. Lots of related negative words also appear e.g. “stupid”, “hate”, “shit”, “fuck”, “bitch”.
Interestingly few of the terms shown include Twitter users or hashtags.
Finally I tried the same using “apple” on an earlier smaller set (859,157 tweets):

Unsurprisingly we see “store”, “iphone”, “ipad” “steve”. Hashtags include “#wwdc”, “#apple” and “#ipad”. The Twitter accounts shown are errors due to string-matching on “apple” except for @techcrunch.
I find it interesting to see competitor brands being mentioned in the same tweets (e.g. “google”, “microsoft”, “android”, “samsung”, “amazon”, “nokia”), although the firms are obviously related to “apple”.
An improvement would be to remove words from the chart that match the original pattern (hence removing words like “apple” and “#apple” but keeping everything else). Removing near-duplicate terms (e.g. “apple”, “apples”, “apple'”) and performing common string clean-ups (removing punctuation) which also help.
It would also be good to change the colour channels – perhaps using red for commonly-negative words and green for commonly-positive words, with the rest in a neutral colour. Maybe we could also colour the neutral words differently if they’re commonly associated with the key word (e.g. brands of the key word).
Getting started with Disco was easy enough. The installation takes a few hours (the Disco project instructions assume a certain familiarity with networked systems), after that editing the examples is straightforward. Visualising using Andreas’ code was very straight-forward. The source will be posted around the time of my PyCon tutorial in March.
Ian is a Chief Interim Data Scientist via his Mor Consulting. Sign-up for Data Science tutorials in London and to hear about his data science thoughts and jobs. He lives in London, is walked by his high energy Springer Spaniel and is a consumer of fine coffees.
Office social graph connectivity using NetworkX
I wanted an excuse to play with the Python NetworkX graph visualisation library and recently I joined AdaptiveLab to consult on some data science & visualisation problems. Thus formed the question – how were we all connected together? I figured that looking at who follows us all will yield a little insight into the people we have in common. I’m particularly interested in this question seeing as I was living in Brighton, then lived in Chile for most of the year and have only recently moved to London – my social graph is likely to be disjointed to the graph of the existing London-based team.
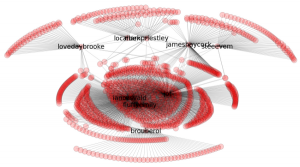
Below I show the follower graph with my new colleagues at the top (James, Kat, Ben, Mark, Steve), Emily, Jon and myself in the middle and my collaborator Balthazar at the bottom:
I chose to visualise followers rather than who-we-follow as I cared about the graph of who-pays-(some)-attention-to-us. I figure this is a good surrogate for people who might actually know us, suggesting a good chance that we have friends and colleagues in common.
Balthazar worked in France with me in StrongSteam (whilst I was in Chile), he’s followed by almost nobody from my usual network. Emily and I are a couple, we’re followed by a lot of the same people. Our friend Jon lives in Brighton and runs the central co-working environment (where we were for 10 years), he is followed by many of the people who follow us. The top of the graph shows that my colleagues are followed by only a few people who follow others in the company (so we all have different social networks), with the exception of boss-James who shares a set of followers with my Jon and myself (I guess because we’re all outspoken in the UK tech scene).
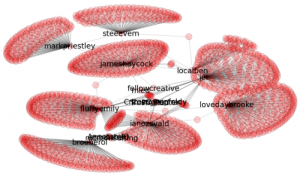
In the above graph I deliberately reduced the number of nodes drawn if they were only connected to one person in the network. Seeing as a few of us have over a thousand followers the graph got too busy too quickly. Below is a subsampled version of the early network with no limit on the number of one-edge-only nodes:
The subsampled network looks nicely organic, like living cells.
The code is on github as twitter-social-graph-networkx, it includes some patches that have just been added back to the python-twitter module to enable whole-graph downloading. You can use this code to download the follower graph for your own network, then plot it using NetworkX (it is configured to use GraphViz as the plots are faster, you can use pure NetworkX if you don’t have GraphViz). The git project has pickles of my social network so if you satisfy the dependencies, you should be good to plot straight away.
Ian is a Chief Interim Data Scientist via his Mor Consulting. Sign-up for Data Science tutorials in London and to hear about his data science thoughts and jobs. He lives in London, is walked by his high energy Springer Spaniel and is a consumer of fine coffees.
Testing 3 modern face detection libraries (face.com, openCV, libccv)
As a research project months back Balthazar and I tested 3 modern face detection libraries (definitely see Balthazar’s write-up). Face.com had just been acquired by facebook, they had a great and free service which annotated not just face locations but also sex, age and emotion. We also tested OpenCV (popular and free) and the lesser known libccv.
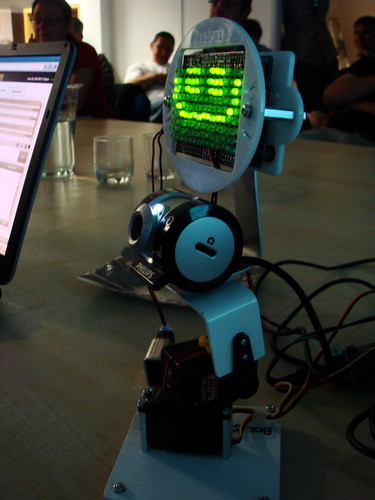
Previously I’d used openCV to build a face tracking robot head in Python and we figured a review of what’s easily available might be fun:
Balthazar ran the face detection process with face.com and OpenCV, I added libccv. We used 200 images kindly provided by Rosario Rascuna (@_sarhus), collected from Instagram and annotated by us. We listed 150 images with faces and 50 without to test how often faces are correctly detected and whether faces are seen where they shouldn’t be.
We did not test the locations of the face, just the absolute count per image. This means that a face could be incorrectly spotted in an image whilst the true face was missed – our scoring system would still say ‘1 was expected and 1 was found so that is correct’. Manual inspection suggested that this is a minor problem (though if I ran the experiment again I’d take the time to hand-annotate every face’s location and check that faces were detected in the right place).
OpenCV provides a set of pre-trained data files (as xml with names like alt_tree_cascade), we tested them individually and then combined all their detections into an uber-detector. The goal for OpenCV was just to see how well it might do without fine tuning.
For OpenCV we used v2.3, for libccv we used v0.1.
I’ll be posting some of the code that we used along with the dataset, I’ll update a link here when I’ve done that.
Results:
- face.com found 144 of the 150 images with faces with 0 false positives (i.e. it didn’t say once that an image without a face had a face)
- OpenCV found 93 images with faces of the 150 images and an additional 4 that were false positives
- libccv found 99 images with faces of the 150 images and an additional 6 that were false positives
The short story is that the open source tools are ‘pretty good’ but face.com was better (and is now unavailable). Since this piece of work Stephen’s LambdaLabs offers a RESTful face detection (and recognition) API, I’ve not evaluated it.
There’s clearly room for a web based service in this area, training it with feedback would be a nice feature. Adding face recognition (as LambdaLabs has, but OpenCV/libccv doesn’t) is an obvious bonus. I’ve seen face detection used for:
- cropping uploaded faces in web profile pictures
- filtering non-face photos from photo albums
- filtering face photos from restaurant review sites
I suspect we’ll see more computer vision APIs that make it easier to annotate images (much the reason why I’ve registered this skeleton site for annotate.io), given the rise in photos on sites like Instagram (and flickr before).
Ian is a Chief Interim Data Scientist via his Mor Consulting. Sign-up for Data Science tutorials in London and to hear about his data science thoughts and jobs. He lives in London, is walked by his high energy Springer Spaniel and is a consumer of fine coffees.
Read my book

Oreilly High Performance Python by Micha Gorelick & Ian Ozsvald AI Consulting
Co-organiser
Trending Now
1Leadership discussion session at PyDataLondon 2024Data science, pydata, RebelAI2What I’ve been up to since 2022pydata, Python3Upcoming discussion calls for Team Structure and Buidling a Backlog for data science leadsData science, pydata, Python4My first commit to PandasPython5Skinny Pandas Riding on a Rocket at PyDataGlobal 2020Data science, pydata, PythonTags
Aim Api Artificial Intelligence Blog Brighton Conferences Cookbook Demo Ebook Email Emily Face Detection Few Days Google High Performance Iphone Kyran Laptop Linux London Lt Map Natural Language Processing Nbsp Nltk Numpy Optical Character Recognition Pycon Python Python Mailing Python Tutorial Robots Running Santiago Seb Skiff Slides Startups Tweet Tweets Twitter Ubuntu Ups Vimeo Wikipedia


