Whilst working on data sciencey problems for AdaptiveLab I’m becoming more involved in simple visualisations for proof-of-concepts for clients. This ties in nicely with my PyCon Parallel Computing tutorial with Minesh. I’ve been prototyping a Disco map/reduce tutorial (part 2 for PyCon) using tweets collected during the life of SocialTies during 2011-2012.
Using 11,645,331 tweets on 1 machine running through Disco with a modified word_count example it is easy to filter to keep tweets with a certain word (“loving” in this case) and to plot a word cloud (thanks Andreas!) of the remaining tweets:
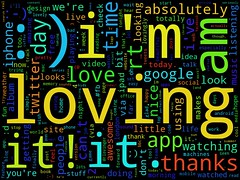
Tweet analysis often shows a self-referential nature – here we see “i’m” as one of the most popular words. It is nice to see “:)” making an appearance. Brands mentioned include “Google”, “iPhone”, “iPad”. We also see “thanks”, “love”, “nice” and “watching” along with “London” and “music”. Annoyingly I’m not cleaning the words so we see “it!”, “it.”, “(via” (with erroneous brackets) and the like which clutter the results a bit.
Next I’ve applied “hating” as the filter to the same set:
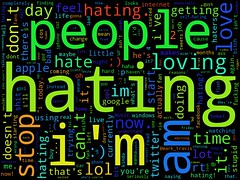
One of the most mentioned words is “people” which is a bit of a shame, along with “i’m”. Thankfully we see some “love” and “loving” there. “apple” appears more frequently than “twitter” or “google”. Lots of related negative words also appear e.g. “stupid”, “hate”, “shit”, “fuck”, “bitch”.
Interestingly few of the terms shown include Twitter users or hashtags.
Finally I tried the same using “apple” on an earlier smaller set (859,157 tweets):
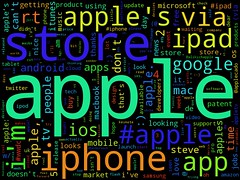
Unsurprisingly we see “store”, “iphone”, “ipad” “steve”. Hashtags include “#wwdc”, “#apple” and “#ipad”. The Twitter accounts shown are errors due to string-matching on “apple” except for @techcrunch.
I find it interesting to see competitor brands being mentioned in the same tweets (e.g. “google”, “microsoft”, “android”, “samsung”, “amazon”, “nokia”), although the firms are obviously related to “apple”.
An improvement would be to remove words from the chart that match the original pattern (hence removing words like “apple” and “#apple” but keeping everything else). Removing near-duplicate terms (e.g. “apple”, “apples”, “apple'”) and performing common string clean-ups (removing punctuation) which also help.
It would also be good to change the colour channels – perhaps using red for commonly-negative words and green for commonly-positive words, with the rest in a neutral colour. Maybe we could also colour the neutral words differently if they’re commonly associated with the key word (e.g. brands of the key word).
Getting started with Disco was easy enough. The installation takes a few hours (the Disco project instructions assume a certain familiarity with networked systems), after that editing the examples is straightforward. Visualising using Andreas’ code was very straight-forward. The source will be posted around the time of my PyCon tutorial in March.
Ian is a Chief Interim Data Scientist via his Mor Consulting. Sign-up for Data Science tutorials in London and to hear about his data science thoughts and jobs. He lives in London, is walked by his high energy Springer Spaniel and is a consumer of fine coffees.
4 Comments