Here I’m starting to look into the errors caused in the social media brand disambiguator project. Below I look at true and false positives (correct and mistaken is-a-brand classifications) and plot them against the number of features that two different classifiers can use to calculate their class membership probabilities.
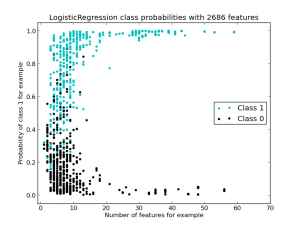
First I’m using the default LogisticRegression classifier. For both of these examples I’m using (1,3) n-grams (uni-, bi- and tri-grams) and a minimum document frequency of 2 occurrences for a term when building the Binary Vectorizer. The Vectorizer is constructed inside a 5-fold cross validation loop, so the number of features found varies a little per fold (you can see this in the two image titles – the title is generated using the final CV Vectorizer).
Class 1 (is-a-brand) results are ‘light blue’, they cluster towards the top of the graph (towards probability of 1 of being-in-class-1). Class 0 (is-not-a-brand) results cluster towards the bottom (towards a probability of 0 of being-in-class-1). There’s a lot of mixing around P(0.5) as the two classes aren’t separated terribly well.
We can see that the majority of the points (each circle ignoring which class it is in) have 1 to 10 features by looking along the x-axis, a few go up to over 50 features. Since the features include bi- and tri-grams we’ll see a lot of redundant features for these examples.
If we imagine drawing a threshold for is-class-1 above 0.89 then between all the cross validation test results (584 items across the 5 folds) I’d have 349 true positives (giving 100% precision, 59% recall). If I set the threshold to 0.78 then I’d have 422 true positives and 4 false positives (the 4 black dots above 0.78 giving 99% precision and 72% recall).
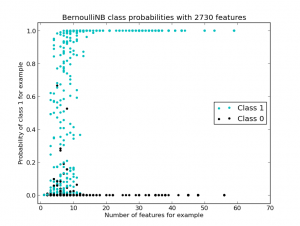
Now I repeat the experiment with the same Vectorizer settings but changing the classifier to Bernoulli Naive Bayes. The diagram shows a much stronger separation between the two classes:
If I choose a threshold of 0.66 then I have 100% precision with 66% recall. If I choose 0.28 then I get 2 false positives giving 99.5% precision with 73% recall. It is nice to be able to visualise the class separations for each of the test rows, to both have a feel for how the classifier is doing and to view how changing the feature set (without modifying the classifier) changes the results.
Looking at these results I’d obviously want to diagnose what the false positive results look like, maybe that gives further ideas for features that could help to separate the two classes. The modifications to learn1_experiments.py are in this check-in on the github project.
Ian is a Chief Interim Data Scientist via his Mor Consulting. Sign-up for Data Science tutorials in London and to hear about his data science thoughts and jobs. He lives in London, is walked by his high energy Springer Spaniel and is a consumer of fine coffees.


3 Comments