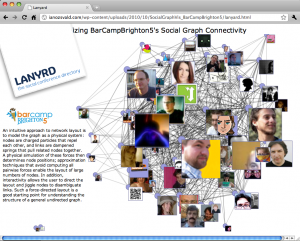
Over the weekend at BarCampBrighton5 I demonstrated a quick visualisation that Kyran and I built over breakfast in Berlin last Friday. It looks like:
To see it yourself open Bar Camp Brighton 5 Visualisation using Chrome or WebKit (it’ll work in Firefox but might be rather slow). It is interactive so it is worth opening, about 60 people are shown here.
If you reload the page you’ll see the force directed graph bouncing around as it settles into a low energy configuration. The nodes are people attending the event, edges are friend links to other people at the event. The image sizes for the nodes reflect the number of links a person has at that event.
As you can see above Jot (the main host and co-organiser) is most connected at the event. Two people aren’t following anyone at the event, they’ve been pushed to the bottom left of the window.
You can drag nodes using the grab-handles (blue circles) or move the entire graph by dragging the image.
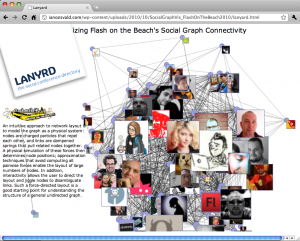
For a larger example (80 people) see the Flash on the Beach 2010 Visualisation:
Here you can see that seb_ly is the most connected, closely followed by niqui and bitchwhocodes. At the bottom left is a sub graph of two nodes – these two people follow each other but don’t follow anyone in the main graph.
In both cases the data is extracted from the relevant Lanyrd pages (BCB5, FOTB), friends for each attendee are read from Twitter and then a graph is built as a JSON dictionary which links nodes (screen_names) to friends (lists of screen_names). Ready to run Python source code is at github: LanyrdViewerUsingProtoVis.
Both of these links should work on a mobile device but they’ll be awfully slow (they’re useless on my iPhone 3G!) 🙂
Kyran used ProtoVis to build the force directed graph, it includes a bit of a hack to make images work on the nodes.
If you’re interested in seeing more of this stuff then Kyran will have more to demo at our upcoming £5 App show and tell.
Ian is a Chief Interim Data Scientist via his Mor Consulting. Sign-up for Data Science tutorials in London and to hear about his data science thoughts and jobs. He lives in London, is walked by his high energy Springer Spaniel and is a consumer of fine coffees.

