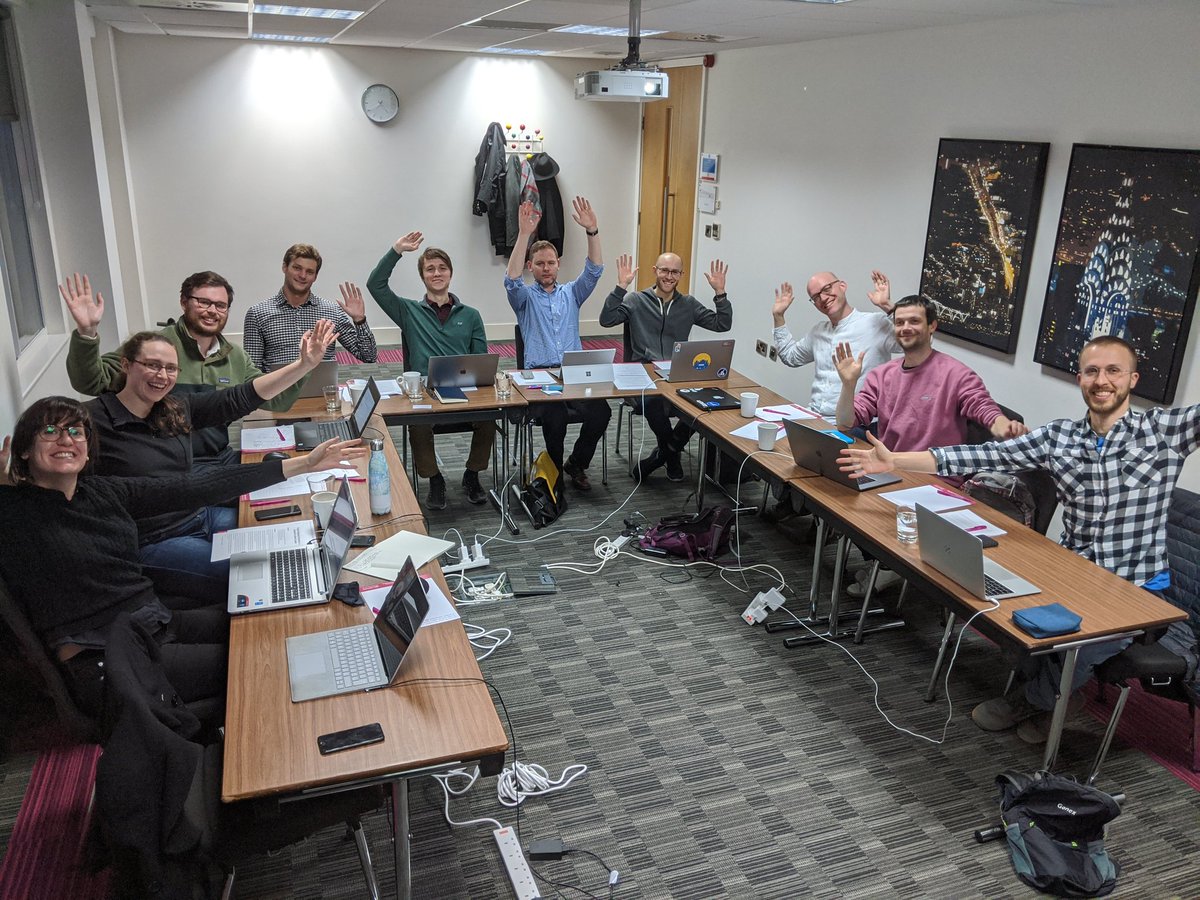
A week back I ran the 4th iteration of my 1 day Successful Data Science Projects course. We covered:
- How to write a Project Specification including a strong Definition of Done
- How to derisk a new dataset quickly using Pandas Profiling, Seaborn and dabl
- Building interactive data tools using Altair to identify trends and outliers (for quick discussion and diagnosis with business colleagues)
- A long discussion on best practice for designing and running projects to increase their odds of a good outcome
- Several diagnosis scenarios for prioritisation and valuation of potential projects
One of the lovely outcomes in the training slack is that new tools get shared by the attendees – I particularly liked Streamlit which was shared as an alternative to my Jupyter Widgets + sklearn estimator demo (which shows a way to hand-build an estimator under Widget control with GUI plots for interactive diagnosis). I’m going to look into integrating this in a future iteration of this course. Here’s my happy room of students:

Ian is a Chief Interim Data Scientist via his Mor Consulting. Sign-up for Data Science tutorials in London and to hear about his data science thoughts and jobs. He lives in London, is walked by his high energy Springer Spaniel and is a consumer of fine coffees.